
In our previous tutorial, we learned how to install Prometheus & gather the system data for monitoring but the data provided by Prometheus was in raw format & was not at all easy to understand. So that is where the Grafana comes into the picture.
Grafana is an open-source tool that allows us to understand the data by visualizing it. Not only can we visualize the data, we can query it or can also create alerts. Grafana can visualize the data from a number of data sources like Prometheus, Graphite, Elasticsearch, AWS cloud-alerts & many more.
In this tutorial, we will learn to install Grafana on Linux systems & also integrate it with Prometheus to get our data visualized in nice & easy to understand dashboards.
Recommended Read: Real Time Linux monitoring with GLANCES monitoring tool
Also Read: Brief & Simple guide to install SLACK on Ubuntu
Install Grafana
We will install Grafana by using the source package, we can download the Grafana with the following command,
$ wget https://dl.grafana.com/oss/release/grafana-6.4.4.linux-amd64.tar.gz
Next extract the tar package,
$ tar xvf grafana-6.4.4.linux-amd64.tar.gz
$ cd grafana-6.4.4/
Now to start the service we will execute the following command,
$ nohup ./grafana-server &
Note:- To restart the Grafana service, kill the PID of grafana & run the above-mentioned command again.
Configuring Grafana
Now that the Grafana server is up, we can configure it from our web-browser. Open the following URL from the browser,
http://localhost:3000 or http://IP_address_of_server:3000
We will get the login screen, enter the user ‘admin’ & password ‘admin’ & we would be redirected to next screen where we would be asked to set up a new password,

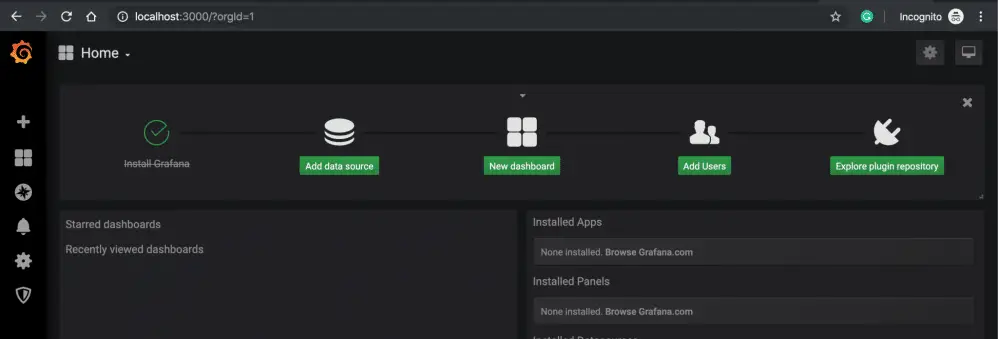
We would then be redirected to the homepage, here we would configure a datasource i.e. Prometheus. Click on ‘Add Data Source’
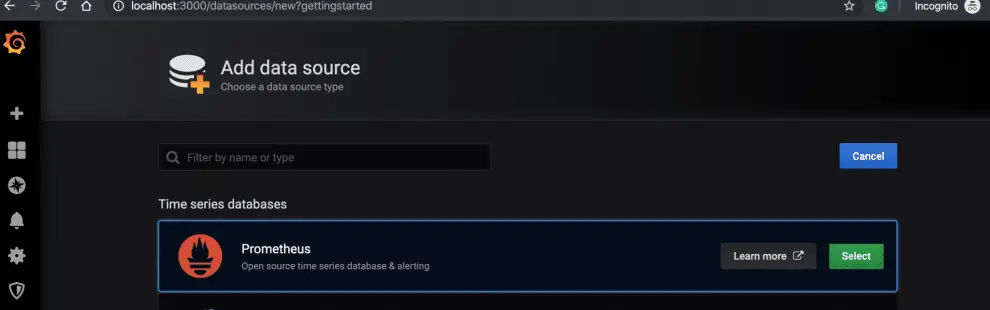
Next select ‘Prometheus’ & press ‘Select’,
Next, we need to enter the Prometheus details. Once you have entered the details correctly, click on ‘Save & Test’, if details entered are correct you will get the message ‘Datasource is working’,

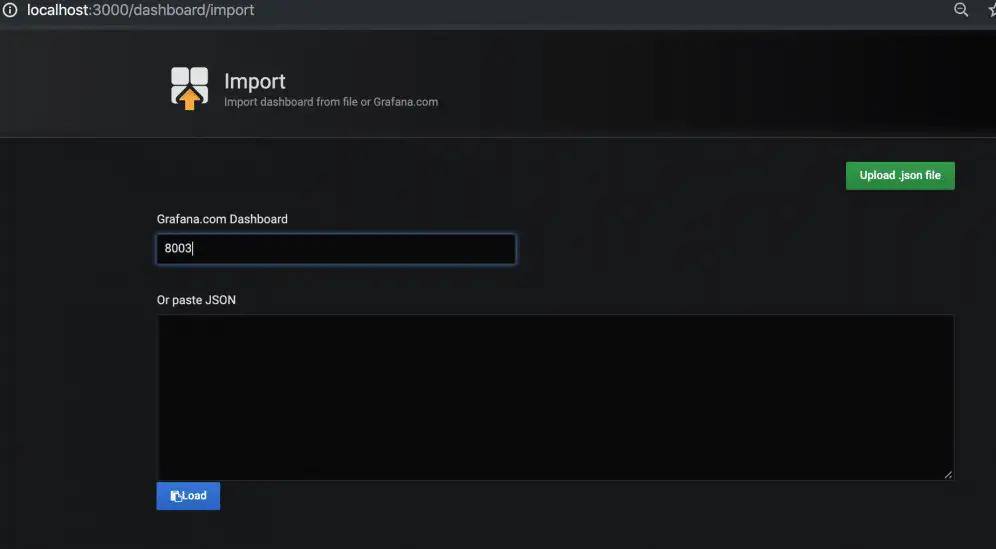
Once the datasource has been added successfully, we can either create our own custom dashboard or can use one of many dashboards available on the grafana official website. So now click on ‘+’ icon on left side on the homepage & click on ‘Import’,

Now we can either enter the dashboard number or the JSON for the dashboard to import it, here we will be using a dashboard numbered ‘159’ to visualize our data (Check it here http://grafana.com/grafana/dashboards/159).
 Click on ‘Load’ to load the dashboard & now we have named the Dashboard & select the Prometheus datasource,
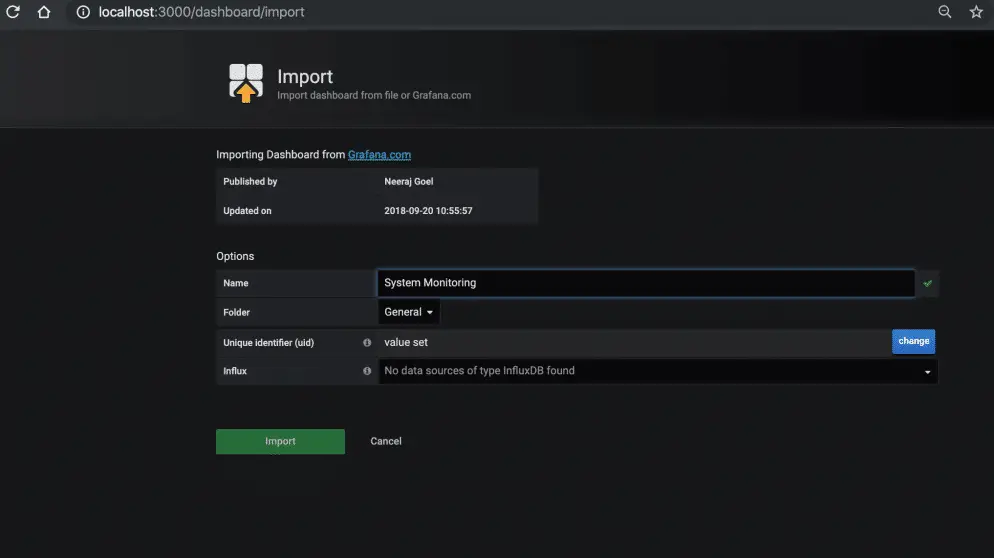
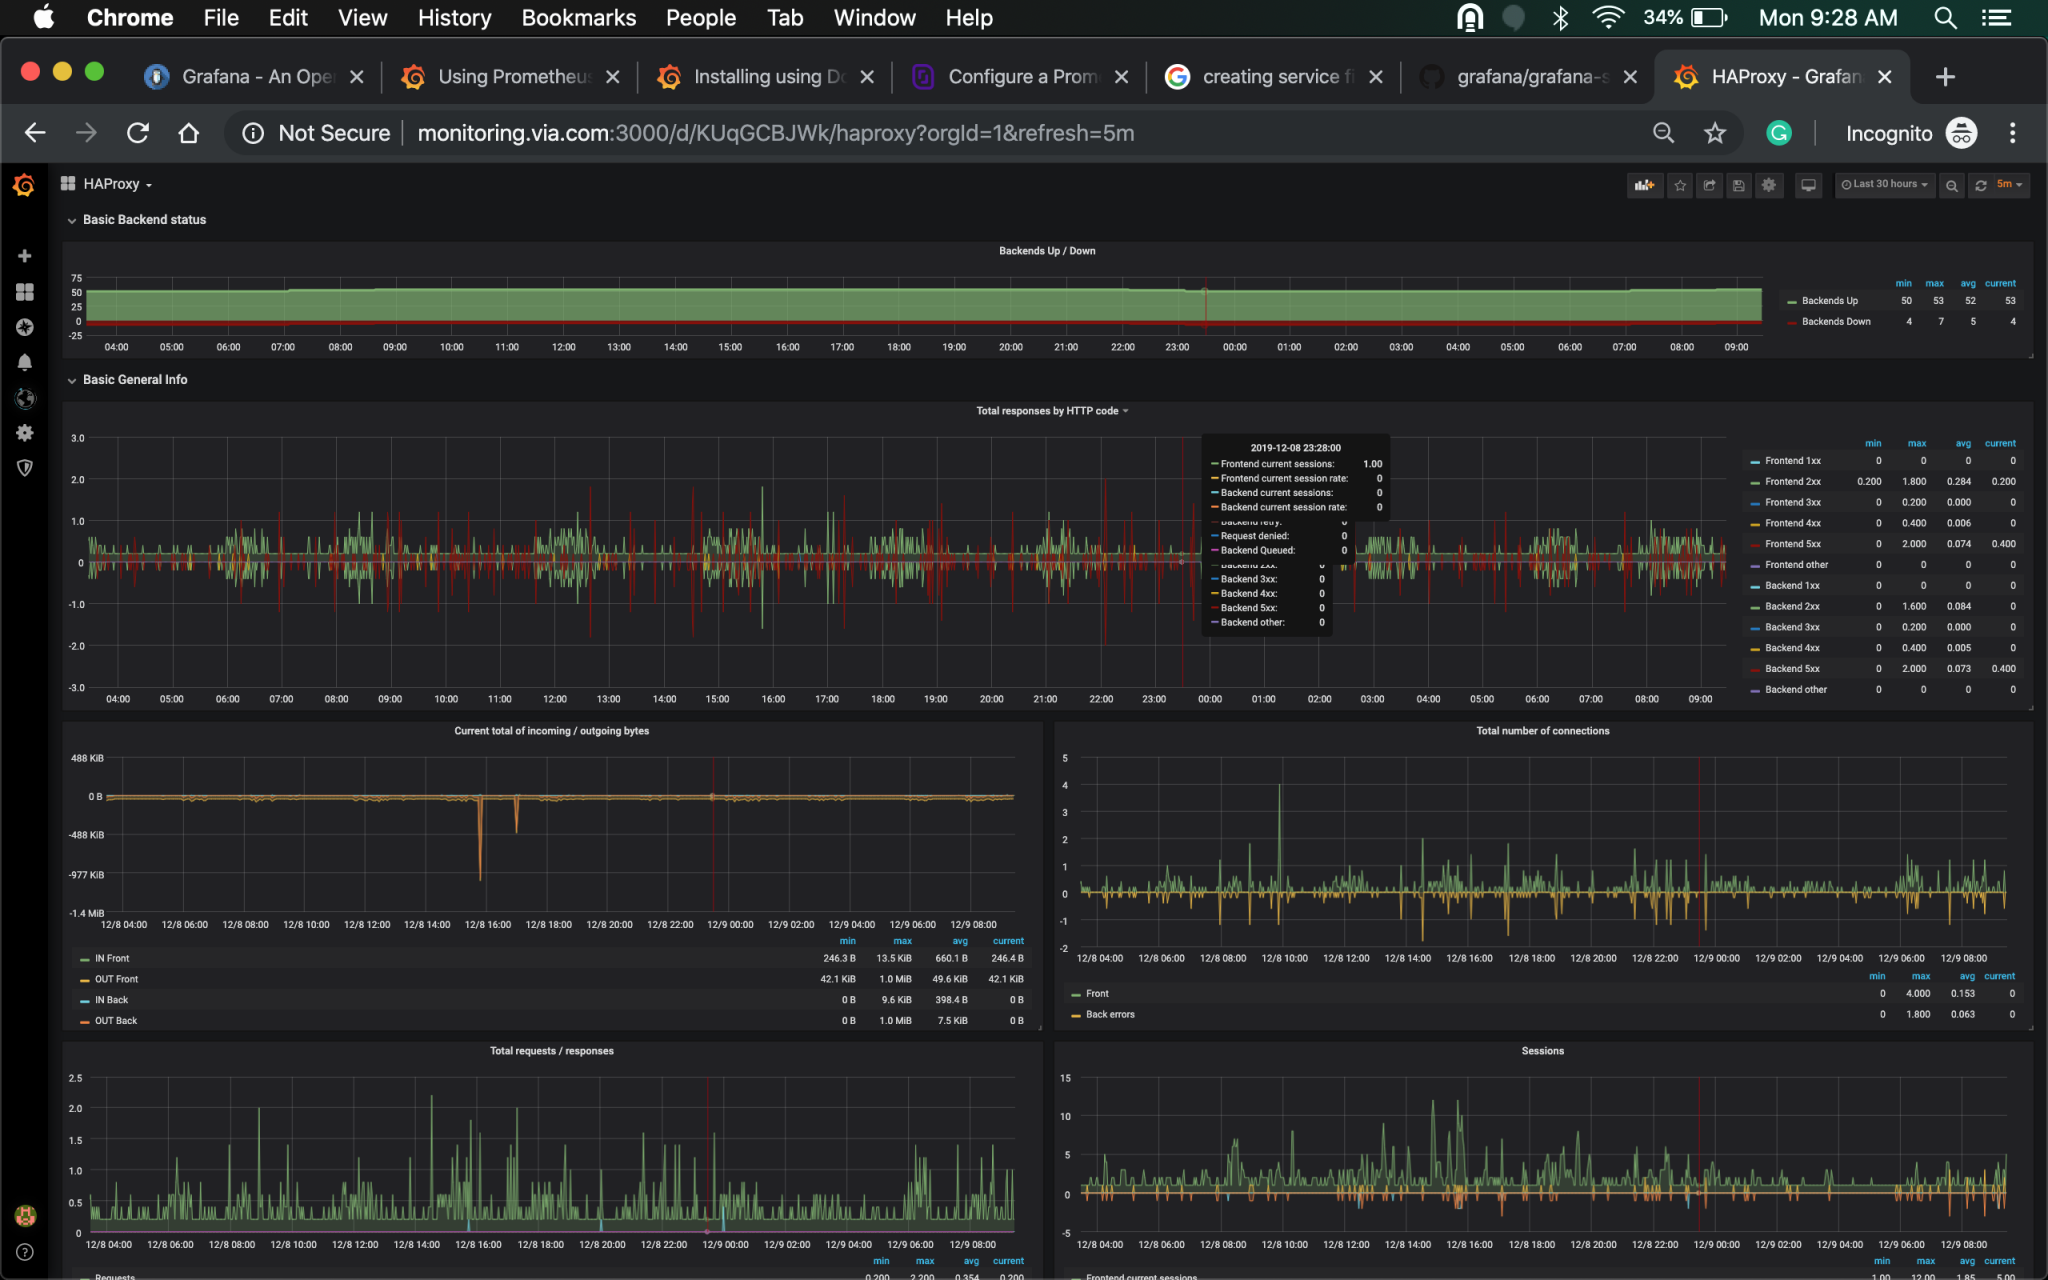
Click on ‘Import’ & we are done. We can now see the newly created dashboard,
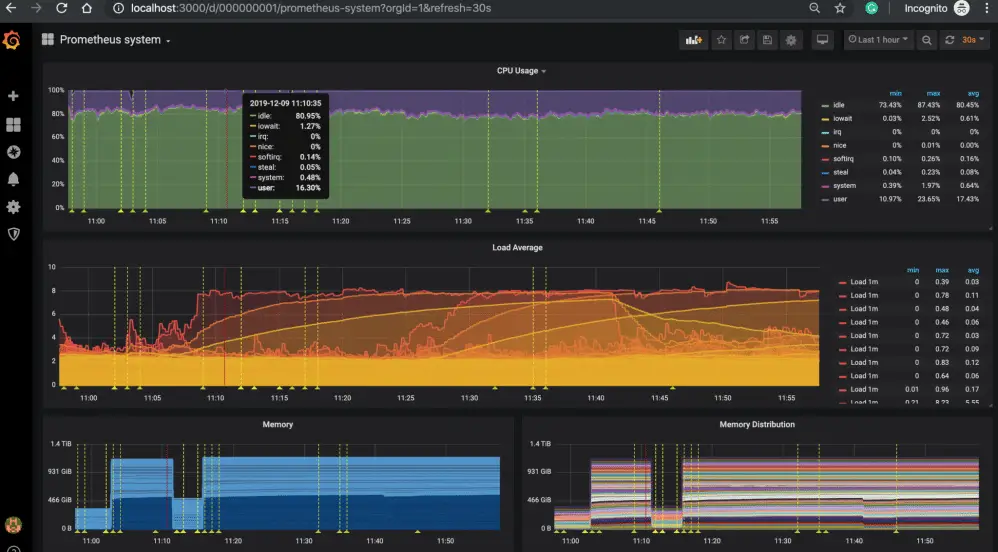
There are a number of other dashboards that we can use or we can also create custom dashboards as per our own needs.
That’s it, we now end our tutorial on how to install Grafana & integrate it with Prometheus. Please feel free to send in any questions or queries using the comment box below.