
There are plenty of Open-Source monitoring solutions available & we have also discussed many of those monitoring solutions on our website like Nagios, Zabbix, OMD, Glances, etc. In this tutorial, we are going to discuss another open-source monitoring tool. Actually, it’s not a single tool but a combination of many tools.
So tools that we are discussing are Prometheus, Node Exporter & Grafana. In this tutorial, we will discuss how we can install Prometheus, Grafana & node exporter but first, let’s discuss briefly the tools first,
Prometheus: It is a very lightweight monitoring application that provides real-time event monitoring & alerting. It records real-time metrics in a time series database built using an HTTP pull model, with flexible queries and real-time alerting.
Grafana: It is an open-source solution for visualizing the data by creating custom dashboards. It allows running data analytics, pulling up metrics that make sense of the massive amount of data & to monitor our apps with the help of cool customizable dashboards. Not only Prometheus, Grafana can also connect to other data sources like Graphite, Influx DB, ElasticSearch, MySQL, PostgreSQL, etc.
Node Exporter: It is a Prometheus exporter for hardware and OS metrics with pluggable metric collectors. It allows measuring of various machine resources such as memory, disk, and CPU utilization. Node exporter provides the needed data, which is then processed by Prometheus & then visualized using Grafana.
Recommended Read: Install Logrotate in Linux (CentOS, RHEL, Fedora, Ubuntu, Debian)
Also Read: Easy guide to setup Nagios monitoring using SSH (check_by_ssh)
We will now discuss the installation and configuration of all these applications. Let’s discuss how to install Prometheus first,
Install Prometheus
To install Prometheus, we need to first download the required packages. Download the package using the following link,
$ wget https://github.com/prometheus/prometheus/releases/download/v2.14.0/prometheus-2.14.0.linux-amd64.tar.gz
Next, untar the package,
$ tar -xvf prometheus-2.14.0.linux-amd64.tar.gz
Next, we need to copy all the services files to /usr/local/bin,
$ cp prometheus-2.14.0.linux-amd64/prometheus /usr/local/bin/
$ cp prometheus-2.14.0.linux-amd64/promtool /usr/local/bin/
Then, also move the configuration files to /etc/prometheus
$ mkdir /etc/prometheus
$ cp -r prometheus-2.14.0.linux-amd64/console_libraries /etc/prometheus
$ cp -r prometheus-2.14.0.linux-amd64/consoles /etc/prometheus
Now we need to create a service file for prometheus,
$ vim /etc/systemd/system/prometheus.service
& paste the following content into the file,
[Unit]
Description=Prometheus
Wants=network-online.target
After=network-online.target
[Service]
Type=simple
ExecStart=/usr/local/bin/prometheus \
--config.file /etc/prometheus/prometheus.yml \
--storage.tsdb.path /var/lib/prometheus/ \
--web.console.templates=/etc/prometheus/consoles \
--web.console.libraries=/etc/prometheus/console_libraries
[Install]
WantedBy=multi-user.target
We will now create the configuration file for prometheus,
$ vim /etc/prometheus/prometheus.yml
& copy the following contents,
global:
scrape_interval: 10s
scrape_configs:
- job_name: 'local-prometheus'
scrape_interval: 5s
static_configs:
- targets: ['localhost:9090']
- job_name: 'Test-Servers'
scrape_interval: 5s
static_configs:
- targets: ['10.100.1.10:9100', 'localhost:9100']
So we have two sections here, one with “job_name: 'local-prometheus' ”, this is the address where local prometheus is working & then there is “- job_name: 'Test-Servers' ”, it contains the node exporter data source address, we will install the node exporter later in this tutorial.
We are now done with the installation of Prometheus & its configuration. We can restart the prometheus service,
$ systemctl daemon-reload
$ systemctl start prometheus
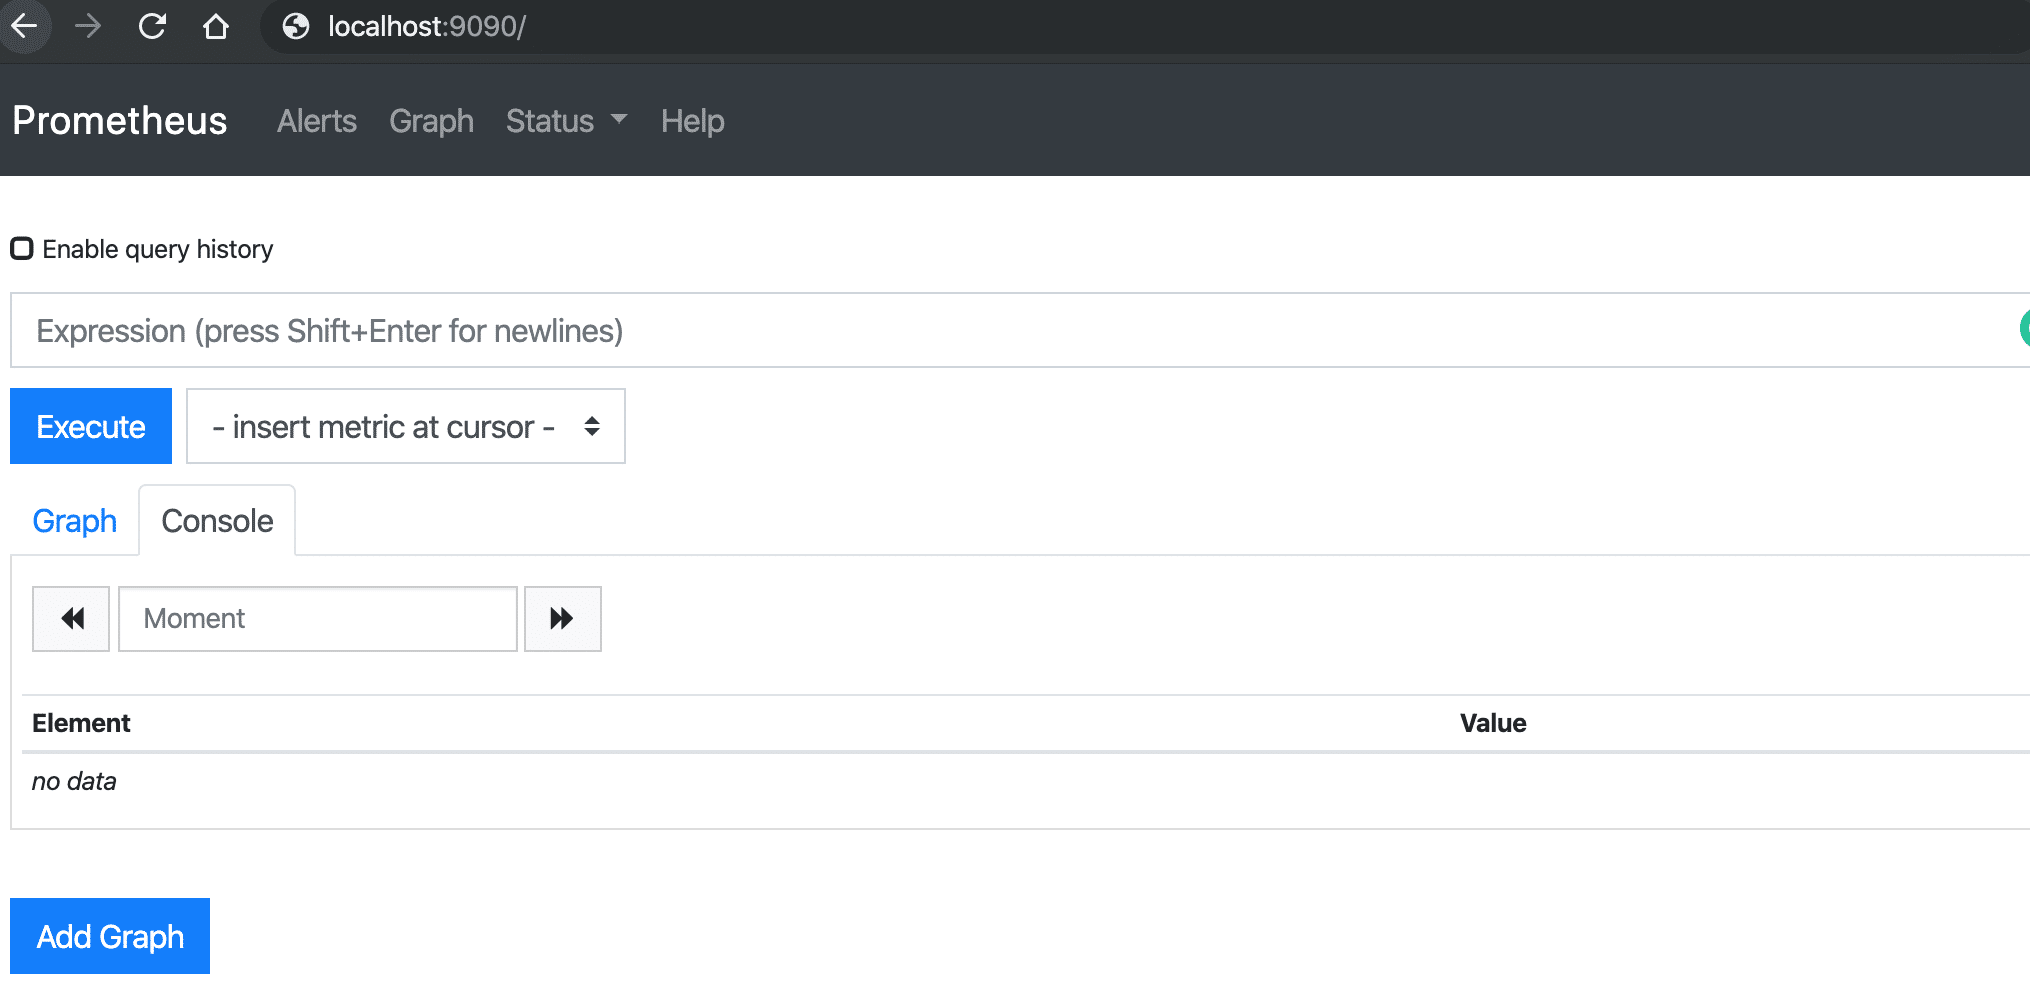
We can now also check the web user interface for prometheus using our web browser, open browser & enter the same address we provided in the configuration file,
http://localhost:9090 OR http://IP_address:9090
Install Node exporter
So now we will install node exporter on all the clients to get all the necessary metrics for monitoring. Installation is similar to Prometheus,
$ wget https://github.com/prometheus/node_exporter/releases/download/v0.18.1/node_exporter-0.18.1.linux-amd64.tar.gz
$ tar -xvf node_exporter-0.18.1.linux-amd64.tar.gz
$ cp node_exporter-0.16.0.linux-amd64/node_exporter /usr/local/bin
Next, we need to create the service file for Node_exporter,
$ vi /etc/systemd/system/node_exporter.service
[Unit]
Description=Node Exporter
Wants=network-online.target
After=network-online.target
[Service]
Type=simple
ExecStart=/usr/local/bin/node_exporter
[Install]
WantedBy=multi-user.target
Start the service for node exporter to start getting the metrics,
$ systemctl daemon-reload
$ systemctl start node_exporter
Lets now check the metrics that we are getting with node_exporter. Open the browser & open the following URL,
http://localhost:9100/metrics
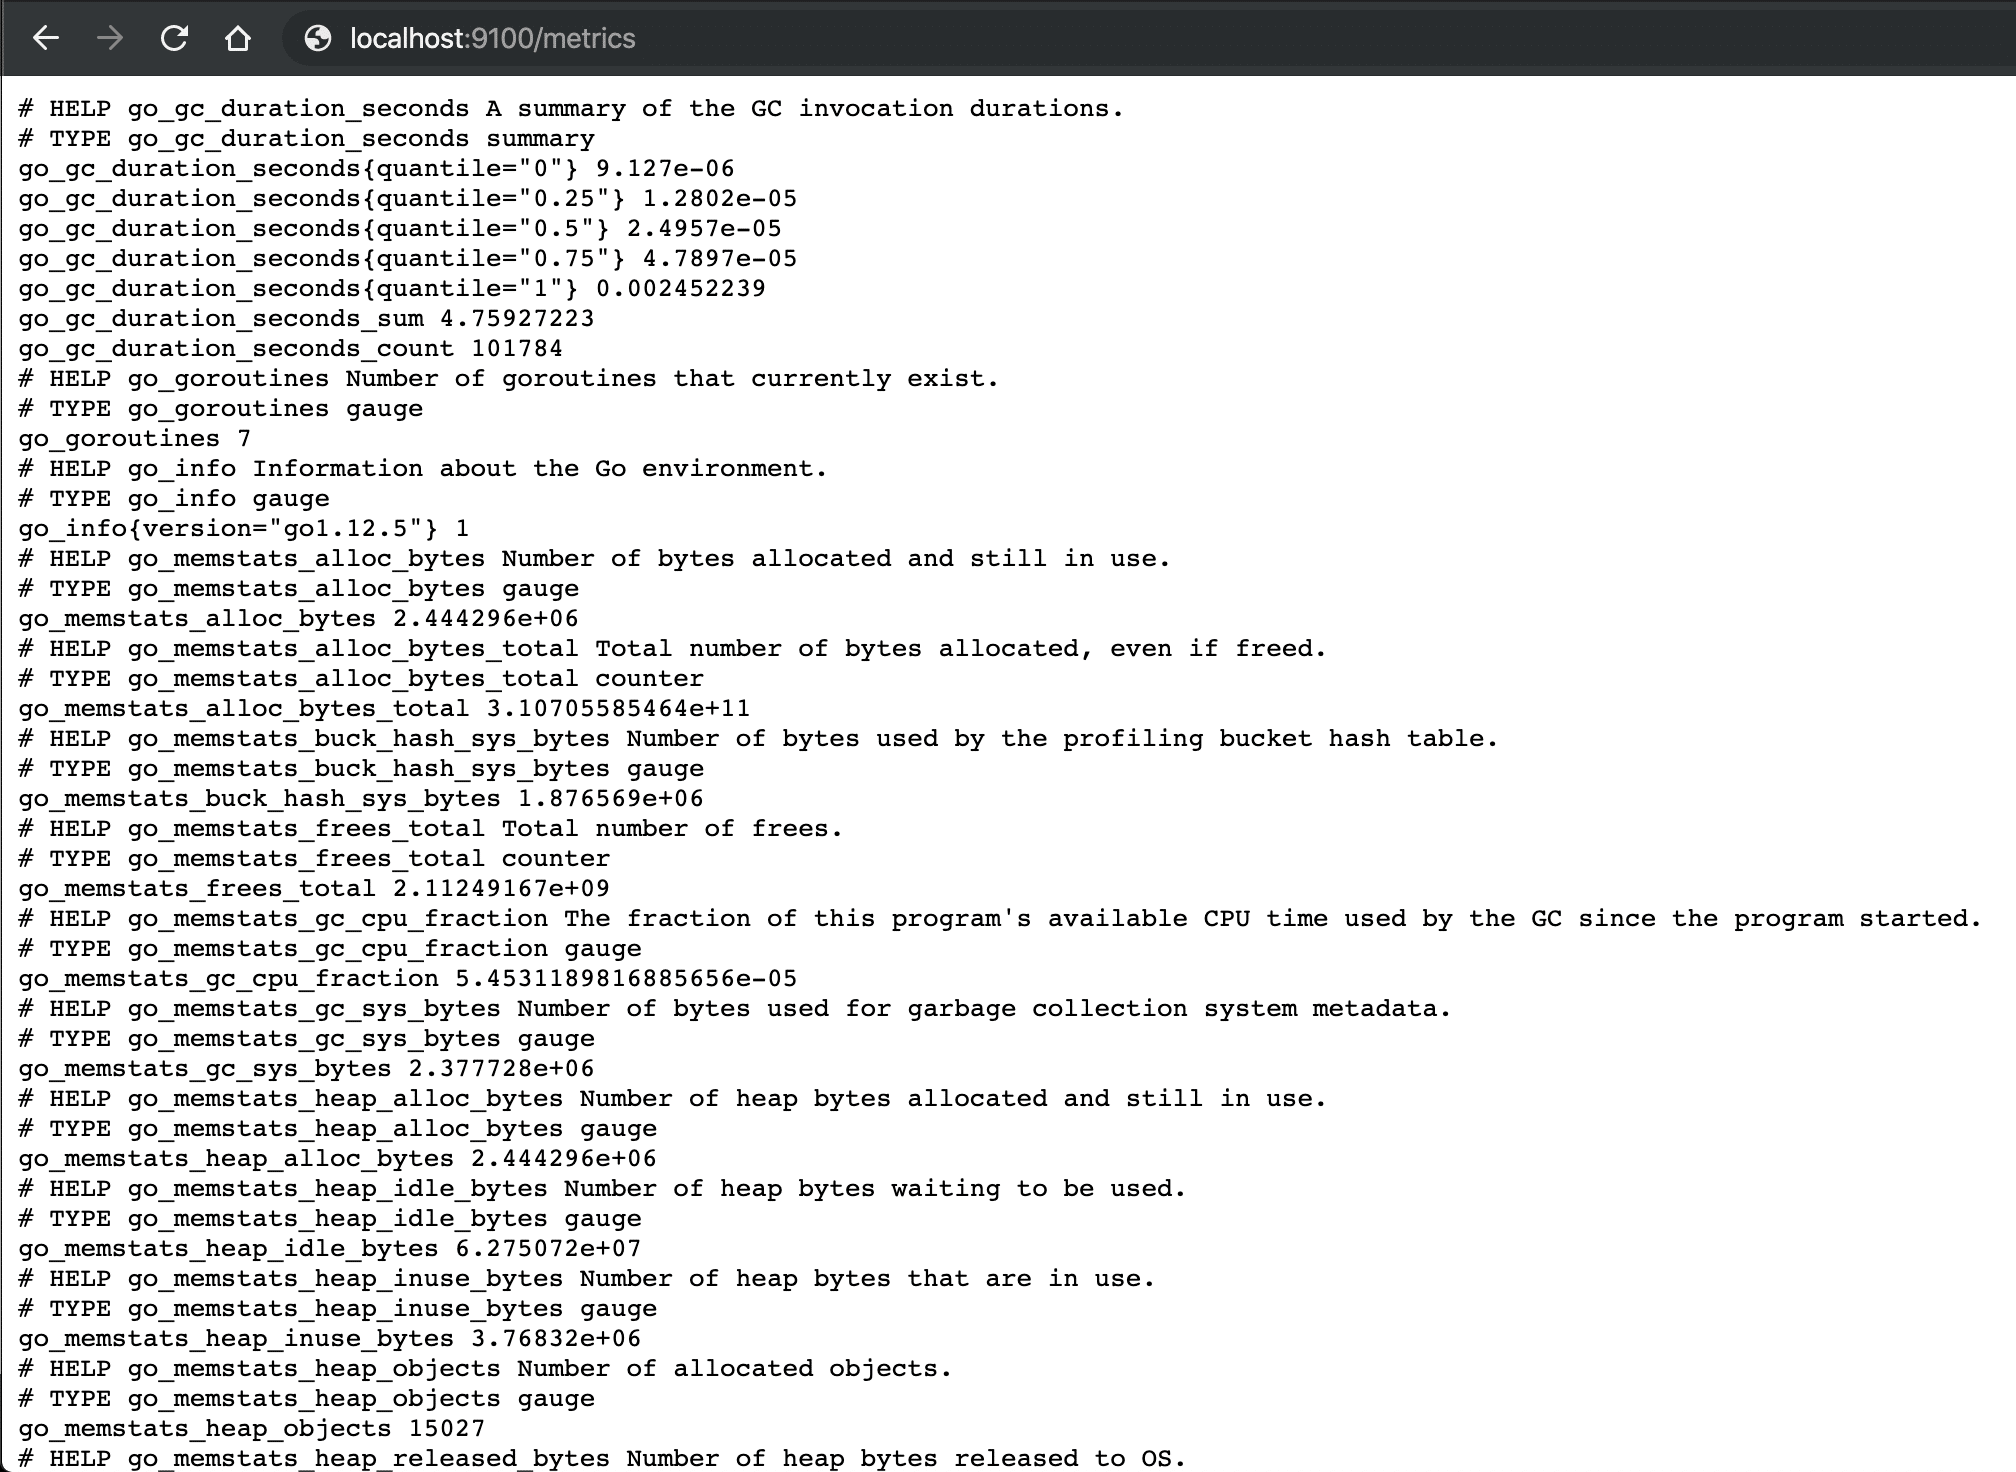
So we are getting the following metrics.
NOT LOOKING PRETTY, RIGHT ???
That’s where Grafana comes to picture, it will process this data & will then provide the data in nice-looking dashboards. We will discuss how we can install Grafana & configure it to process the Prometheus data.
So we end this tutorial on how to install Prometheus & node exporter, please feel free to send in any questions or queries using the comment box below.